Walkthrough
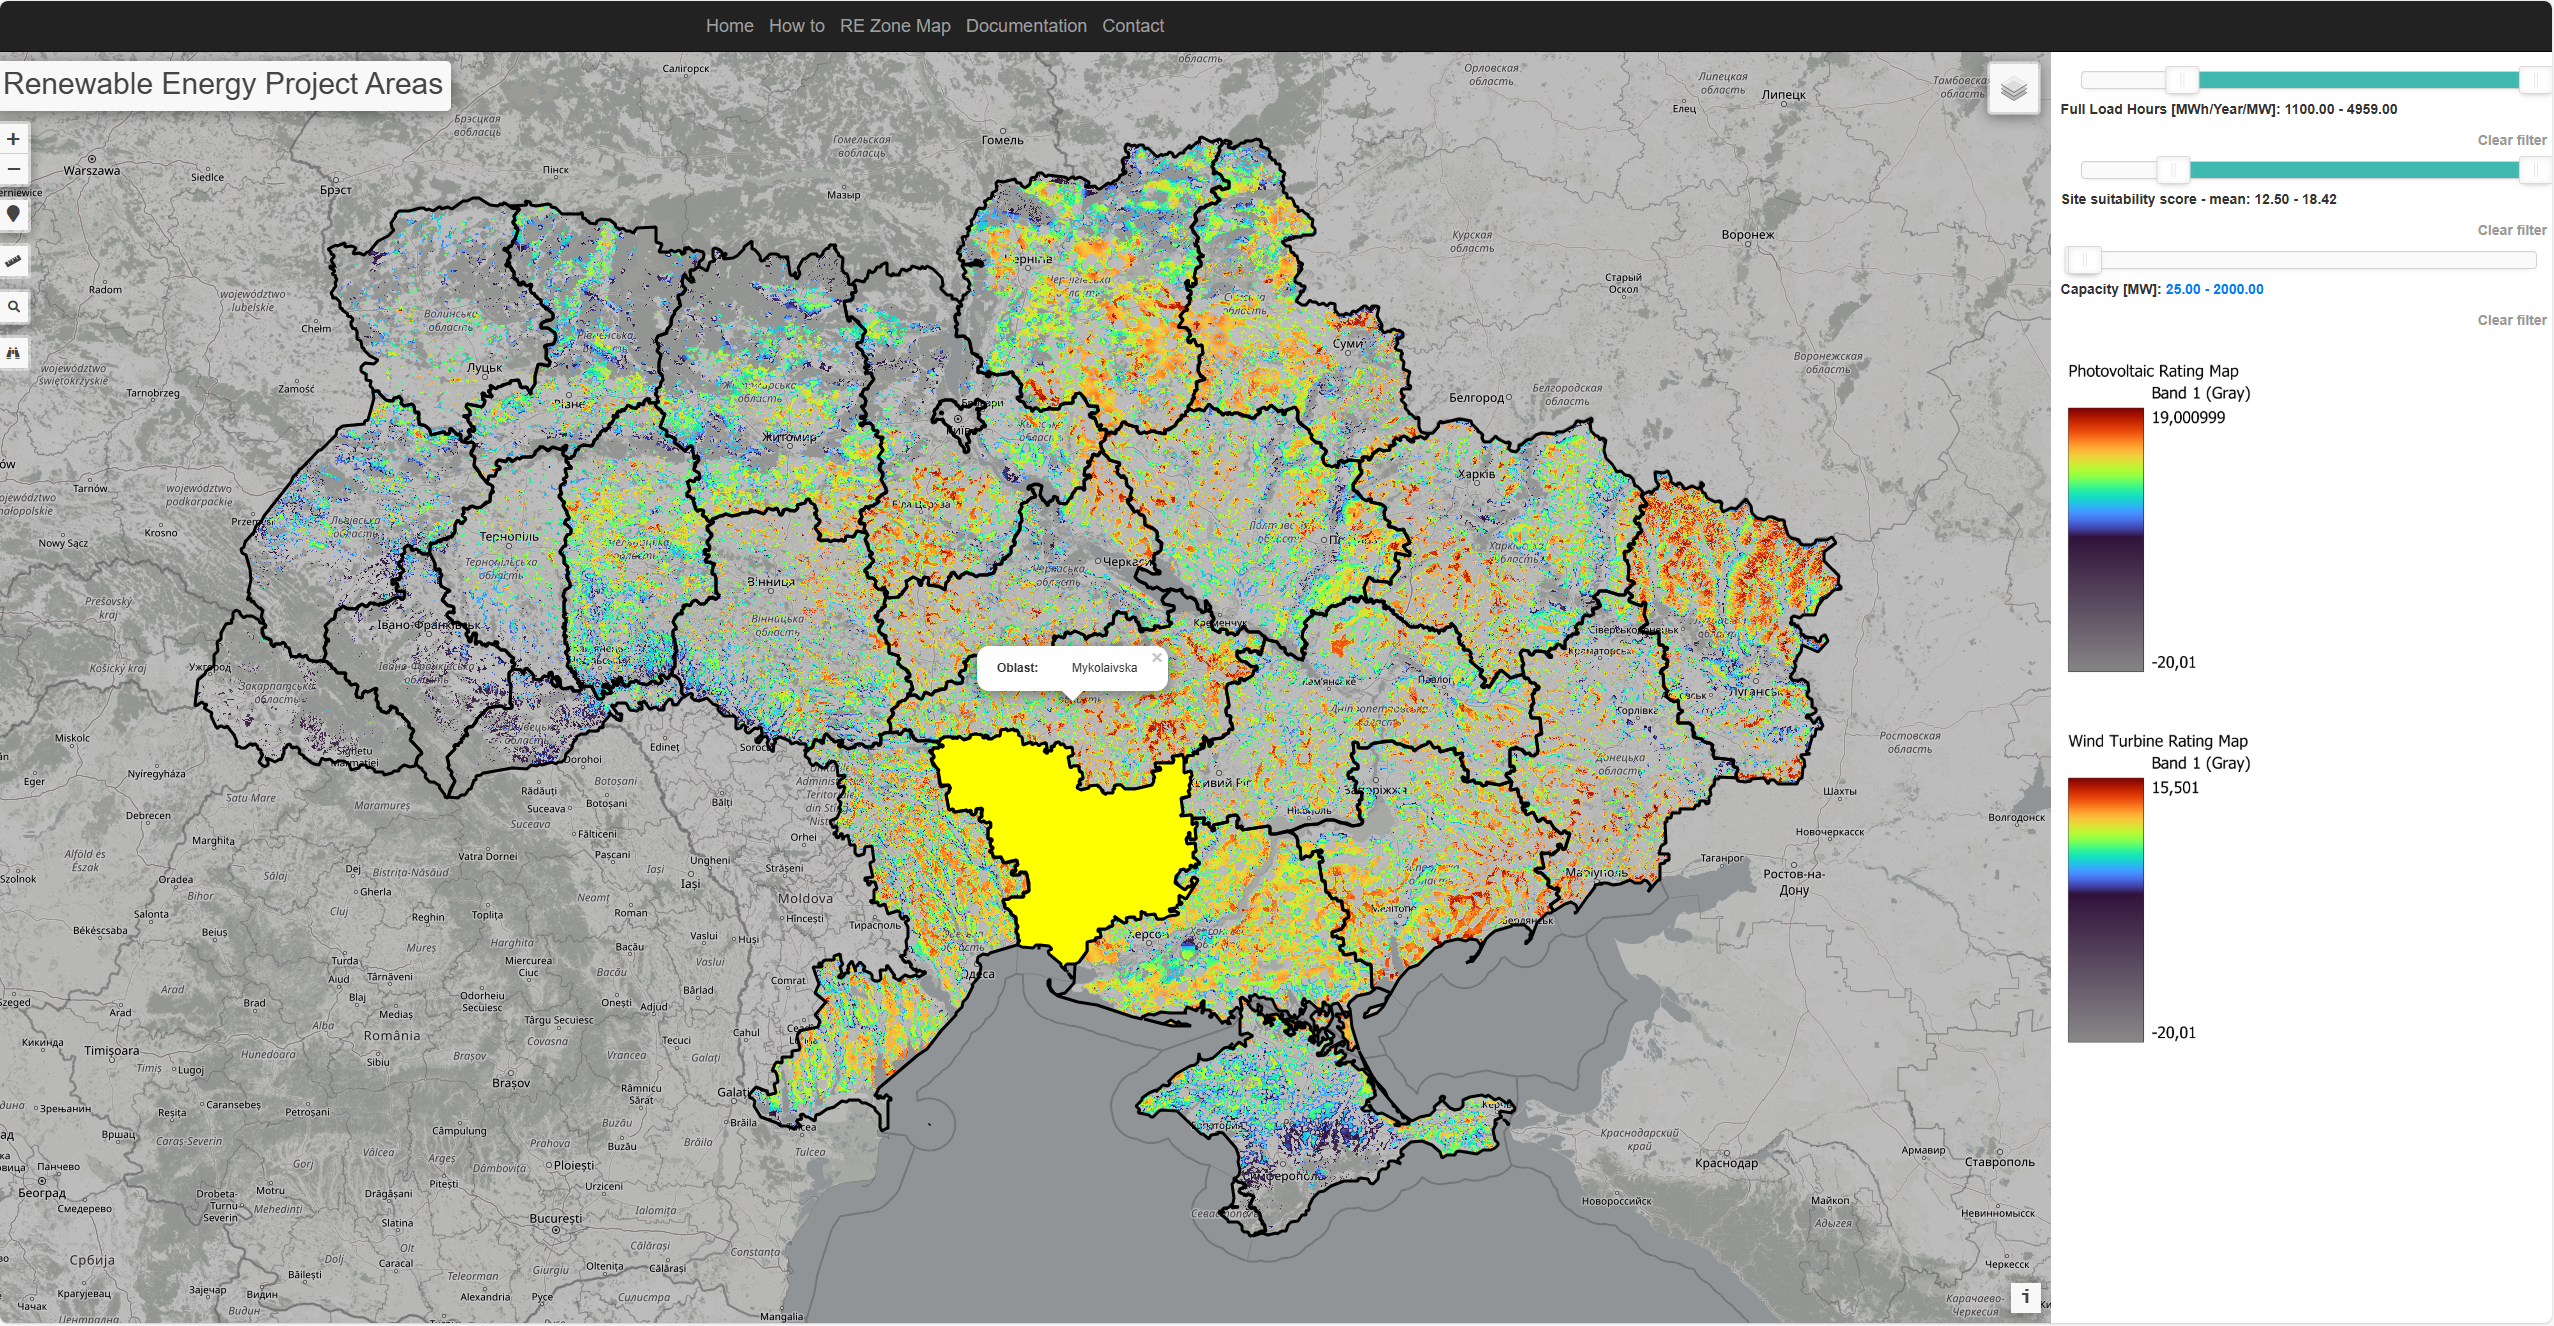
STEP 1: CHOOSING AN ADMINISTRATIVE ZONE
How to: To find a specific administrative zone within Ukraine, such as Oblasts, hover over the administrative layer illustrated via black outlines and a pop-up will appear for the layers marked zone providing a name for the administrative zone.
Use case: Can be used to find an administrative zone which you want to focus on.
STEP 2: CHANGE VISIBLE LAYERS
How to: To activate layers, click the button marked with red, and a menu will appear.
Use case: Can be used to activate or switch project sites, other administrative layers or switch between the photovoltaic or wind turbine layer.
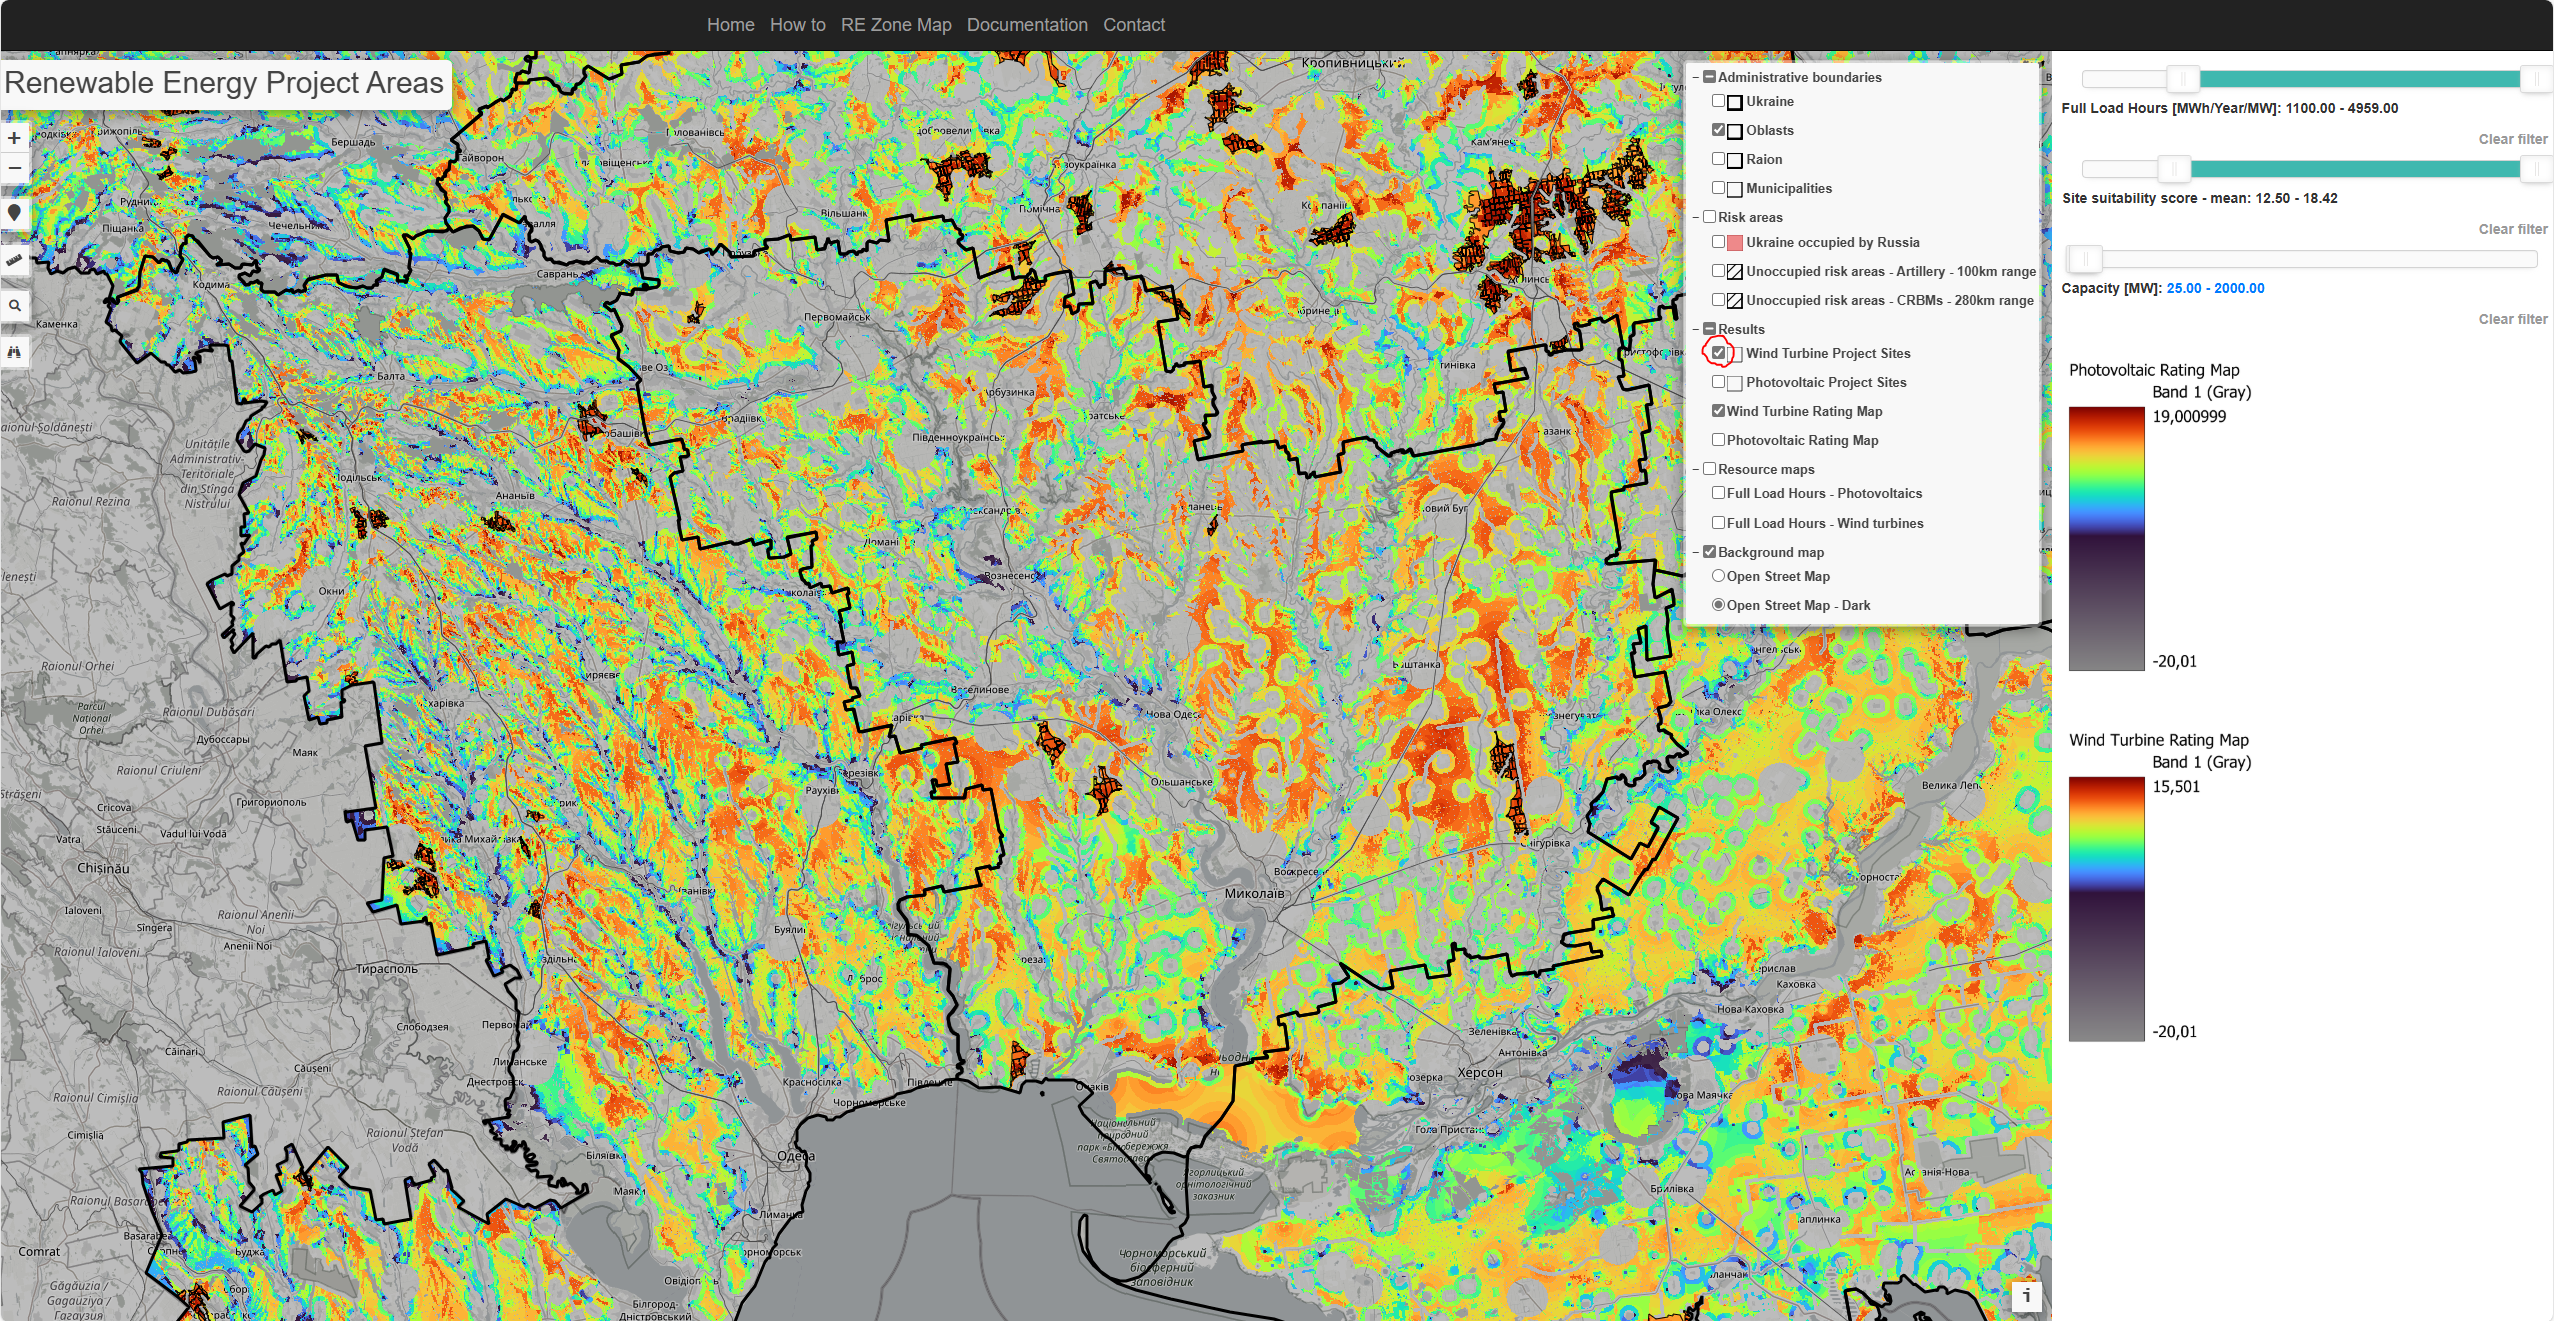
STEP 3.a: ACTIVATING POTENTIAL PROJECT SITES
How to: To activate project sites, click the button marked with red.
Use case: Can be used to activate or switch project sites, switch to other administrative layers or switching to other REZOMA layers.
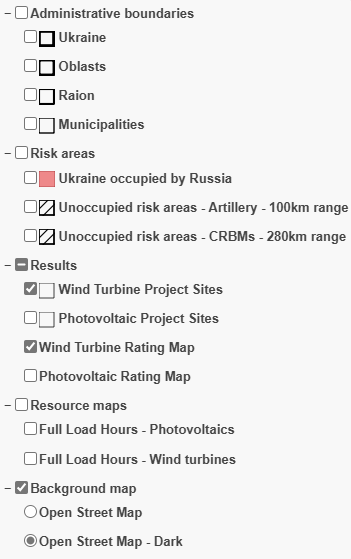
STEP 3.b: ACTIVATING POTENTIAL PROJECT SITES
Click any of the following layers to show or hide them. Each layer adds or removes specific map information to help guide energy planning for wind turbines and photovoltaics.
Administrative Boundaries
- Ukraine: Displays national outline
- Oblasts: Shows provincial borders
- Raion: Reveals district-level divisions
- Municipalities: Local or city boundary lines
Risk Areas
- Ukraine Occupied by Russia: Marks territory under occupation
- Artillery (100 km range): Potential shelling zones
- CRBMs (280 km range): Extended missile threat zones
Results
- Wind Turbine Project Sites: Current wind project locations
- Photovoltaic Project Sites: Current solar PV project locations
- Wind Turbine Rating Map: Suitability layer for wind energy
- Photovoltaic Rating Map: Suitability layer for solar energy
Resource Maps
- Full Load Hours – Photovoltaics: Estimated solar output
- Full Load Hours – Wind: Estimated wind output
Background Map
- Open Street Map: Standard, light-themed base layer
- Open Street Map – Dark: Dark-themed base layer
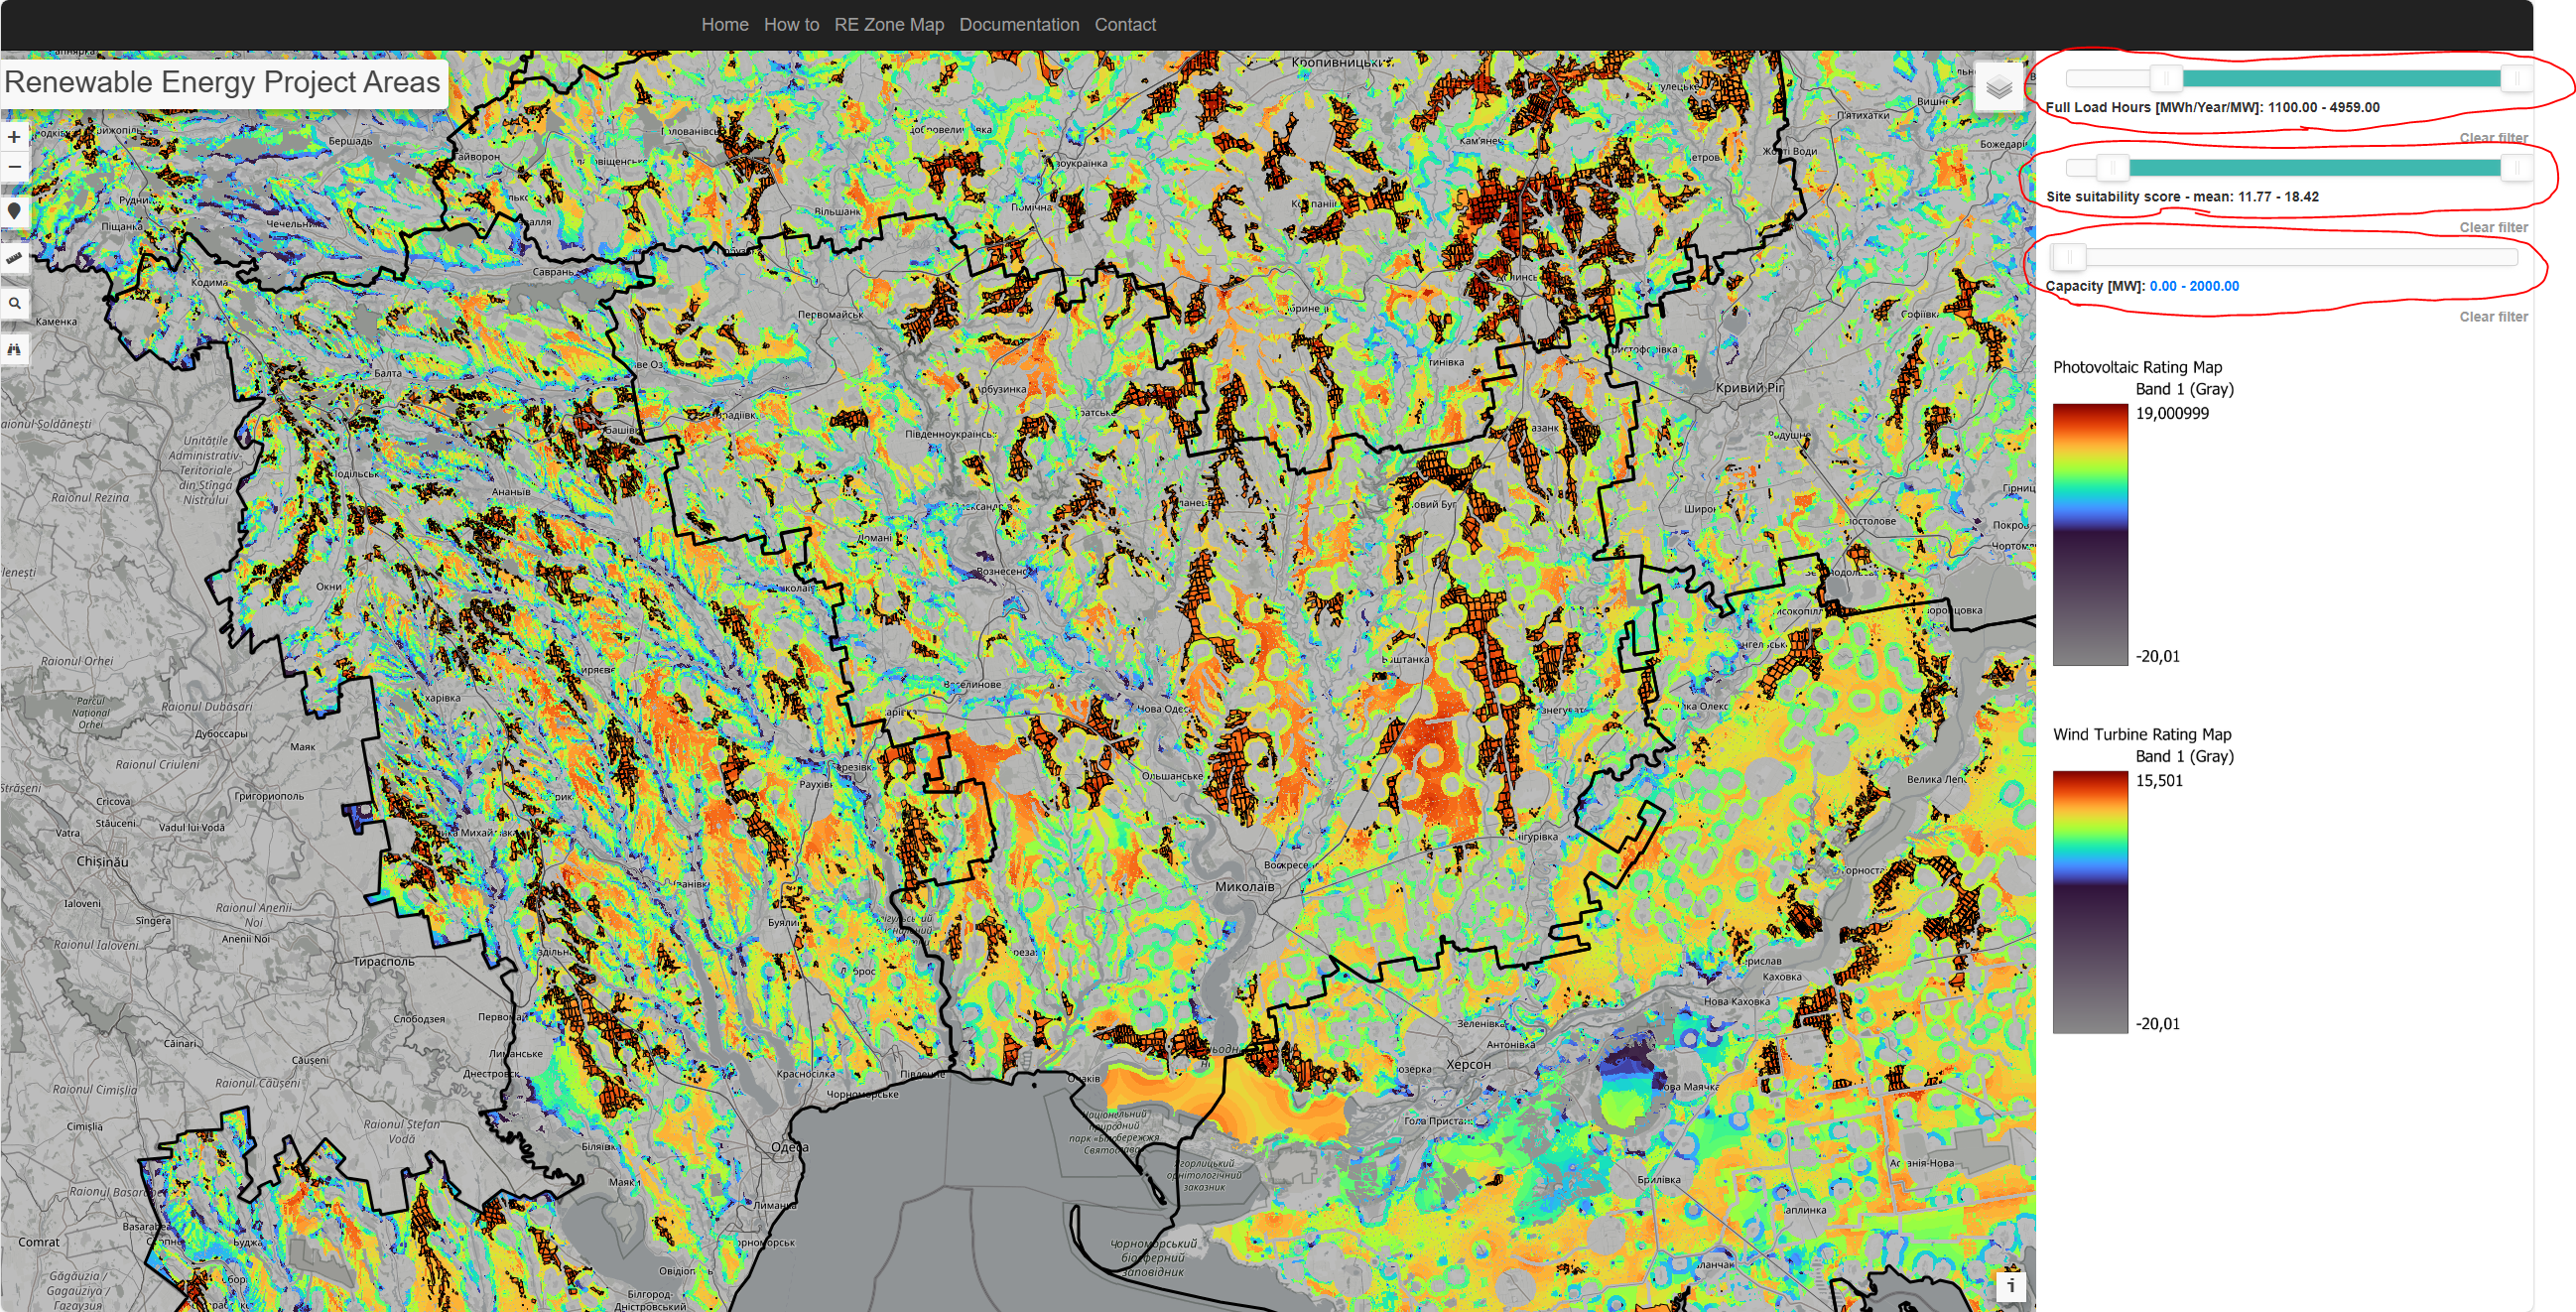
STEP 4.a: CHANGING CRITERIA FOR POTENTIAL PROJECT SITE VIEWABILITY
How to: Use the three sliders marked with a red circle by clicking and holding the mouse, then dragging left or right. Each slider sets a cutoff for which project sites appear on the map, showing only the sites within its range. The sliders apply to both Photovoltaic and Wind Turbine site layers, and the criteria will be combined. The sliders apply to average full load hours, average suitability score and accumulated capacity of the project sites.
Use case: Adjust the sliders to find areas that better match your needs.
NOTE: Viewing all project sites at once may reduce performance.
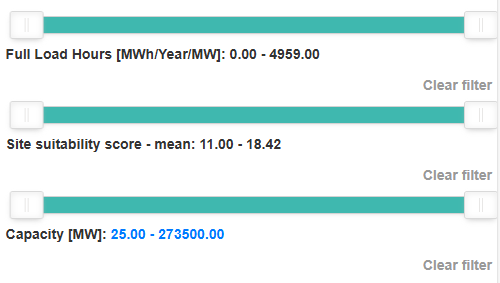
STEP 4.b: USING SLIDERS
Use these sliders to refine project site searches based on specific criteria:
- Full Load Hours [MWh/Year/MW]: Narrows down sites by expected annual operating hours for each megawatt of capacity.
- Site Suitability Score (mean): Filters locations by an overall suitability index, combining factors like wind/solar resources, land use, and environmental constraints.
- Capacity [MW]: Restricts sites based on total installed capacity range (e.g., from smaller projects to very large ones).
Each slider shows the currently selected range. Click “Clear filter” to reset the associated slider to its full possible range.
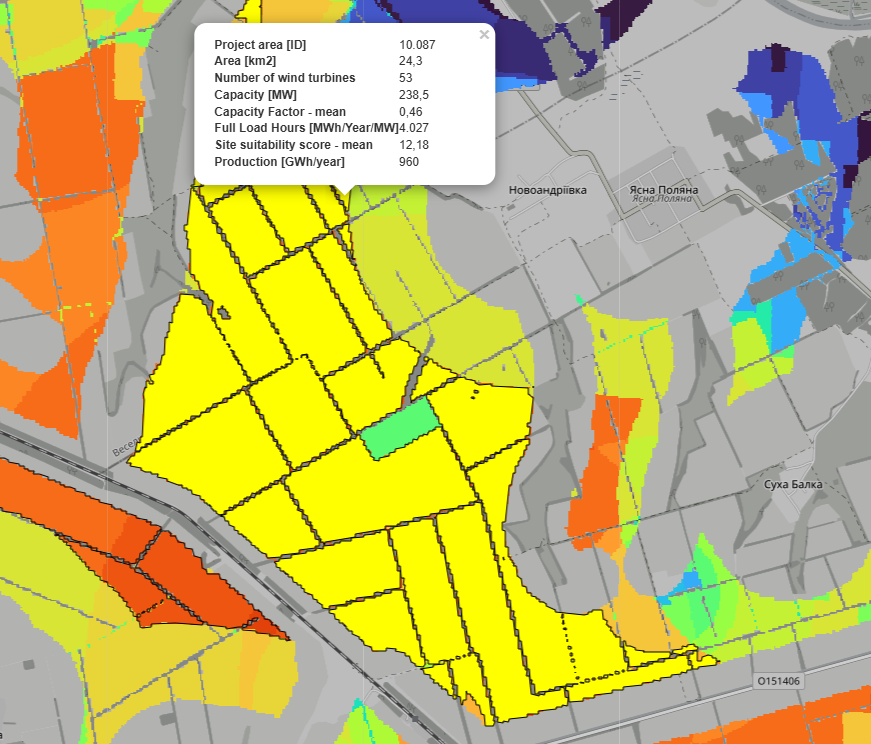
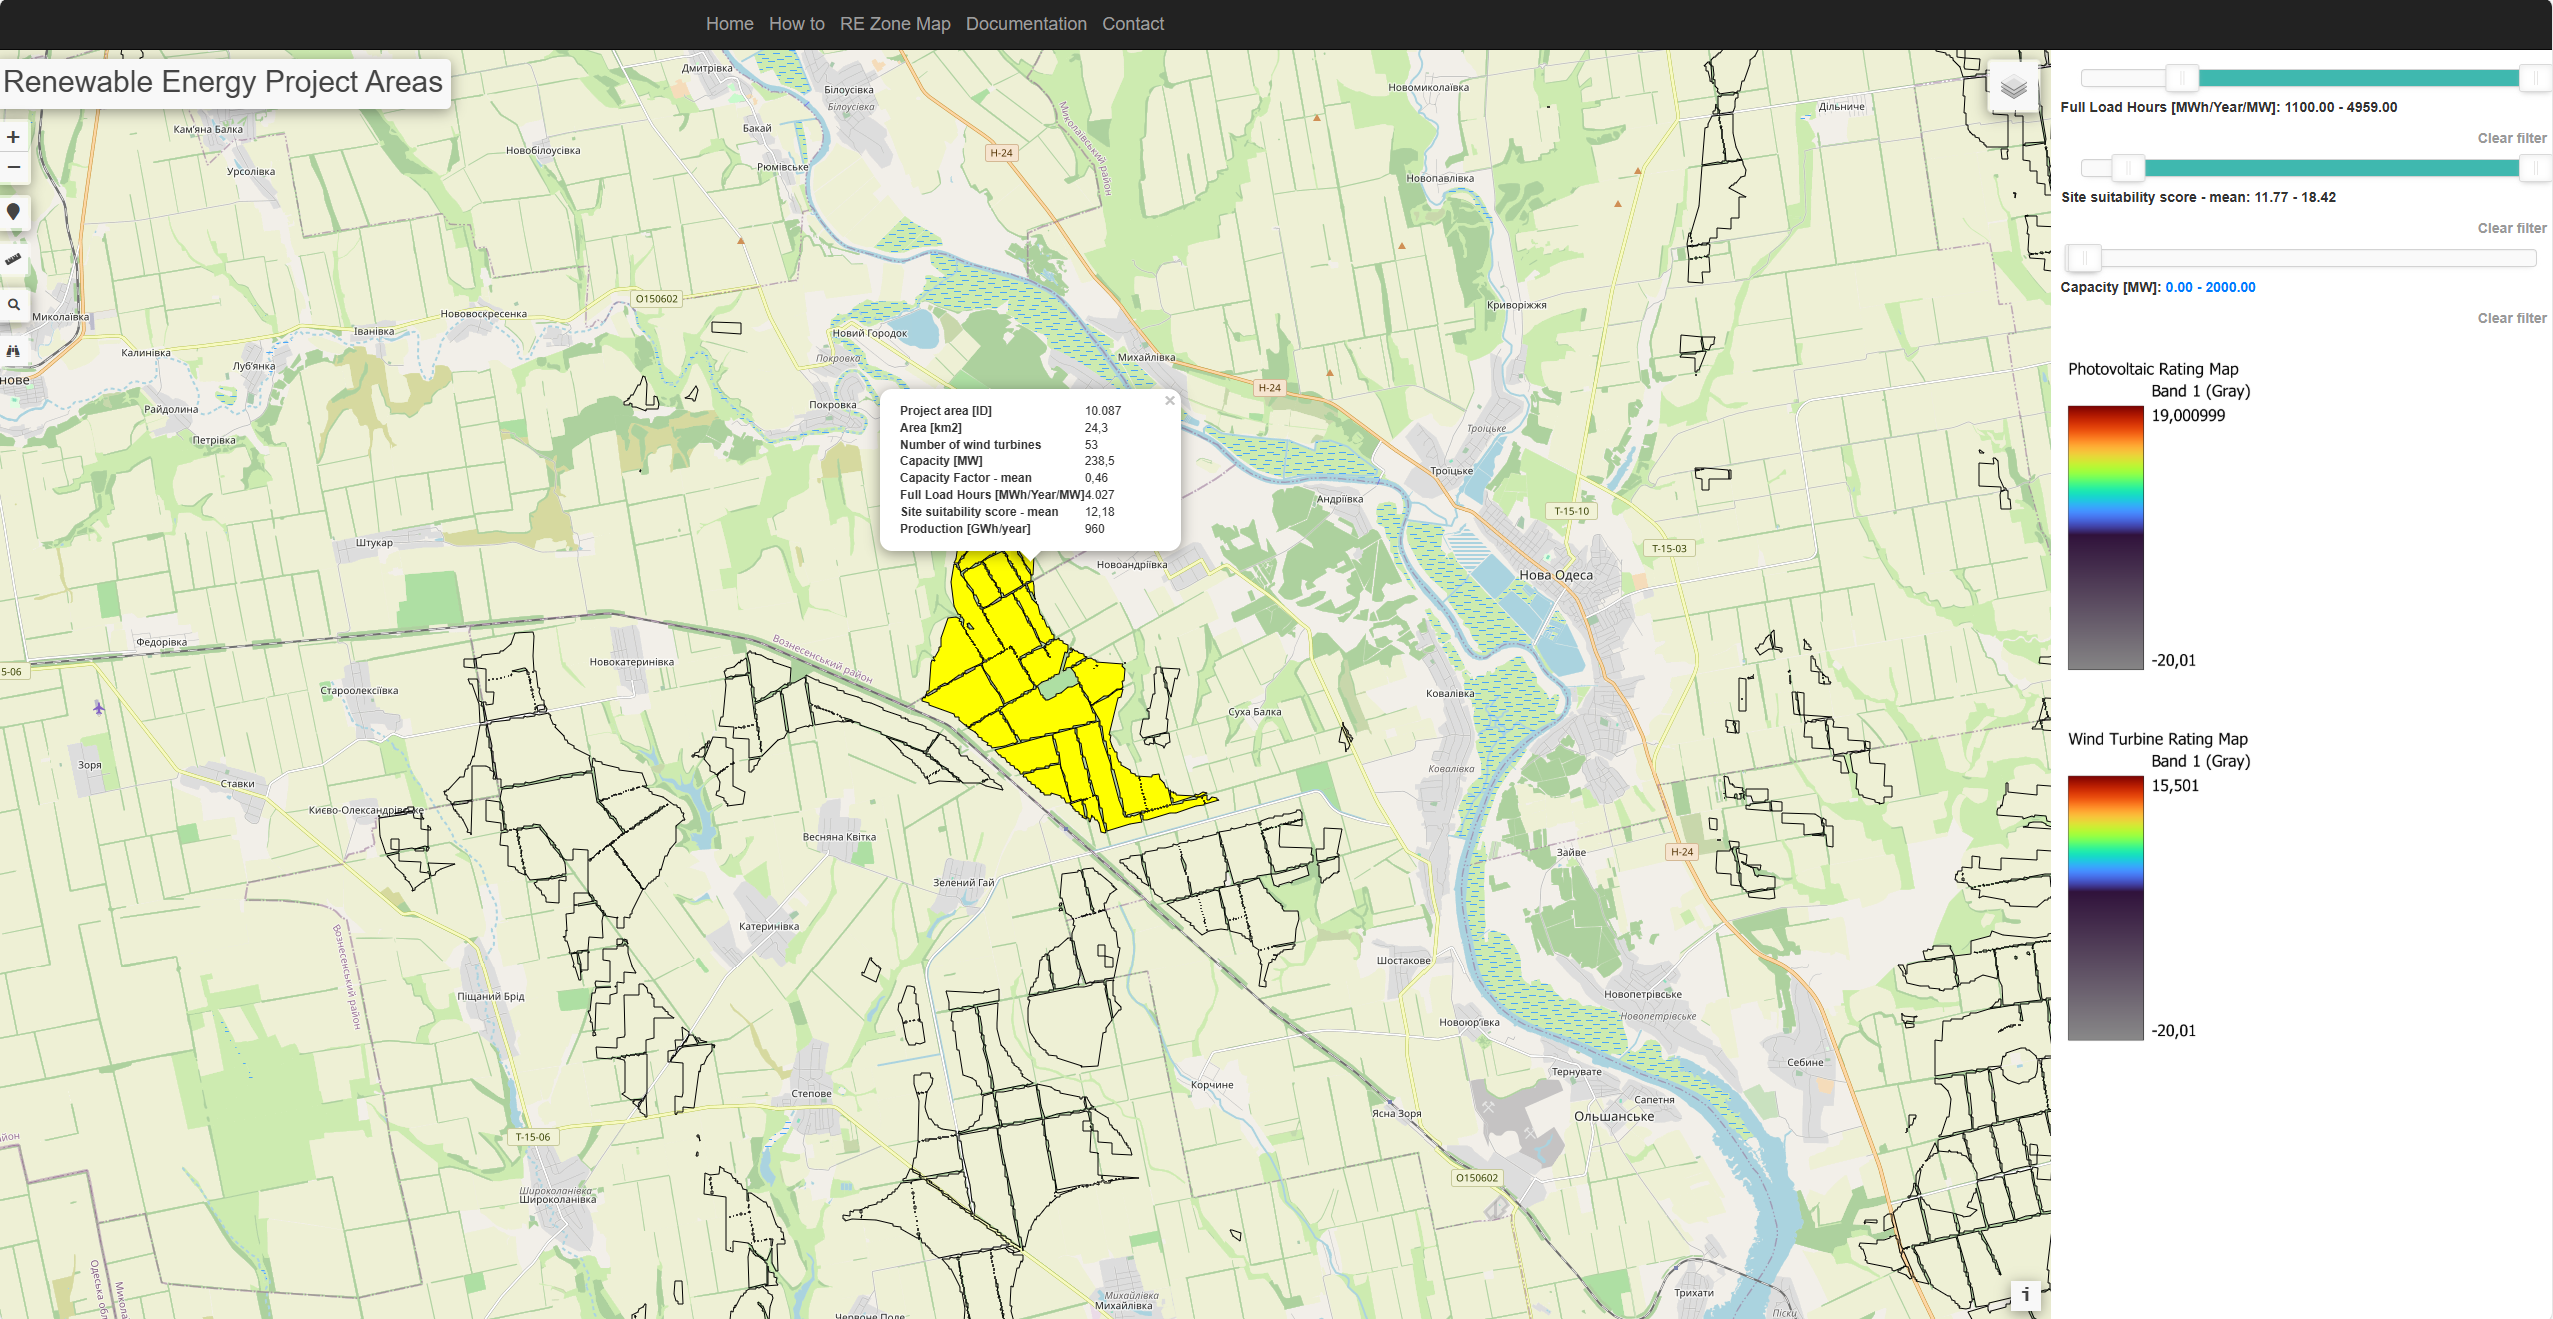
STEP 5: CHOOSING A POTENTIAL SITE
How to: Each potential project site is illustrated with a black outline. When hovered over with the mouse, a textbox appears which shows key results such as estimates of capacity and annual production. Furthermore, the specific site gets marked with yellow.
Use case: Use the values to compare different sites and to choose which area to further investigate the feasibility.
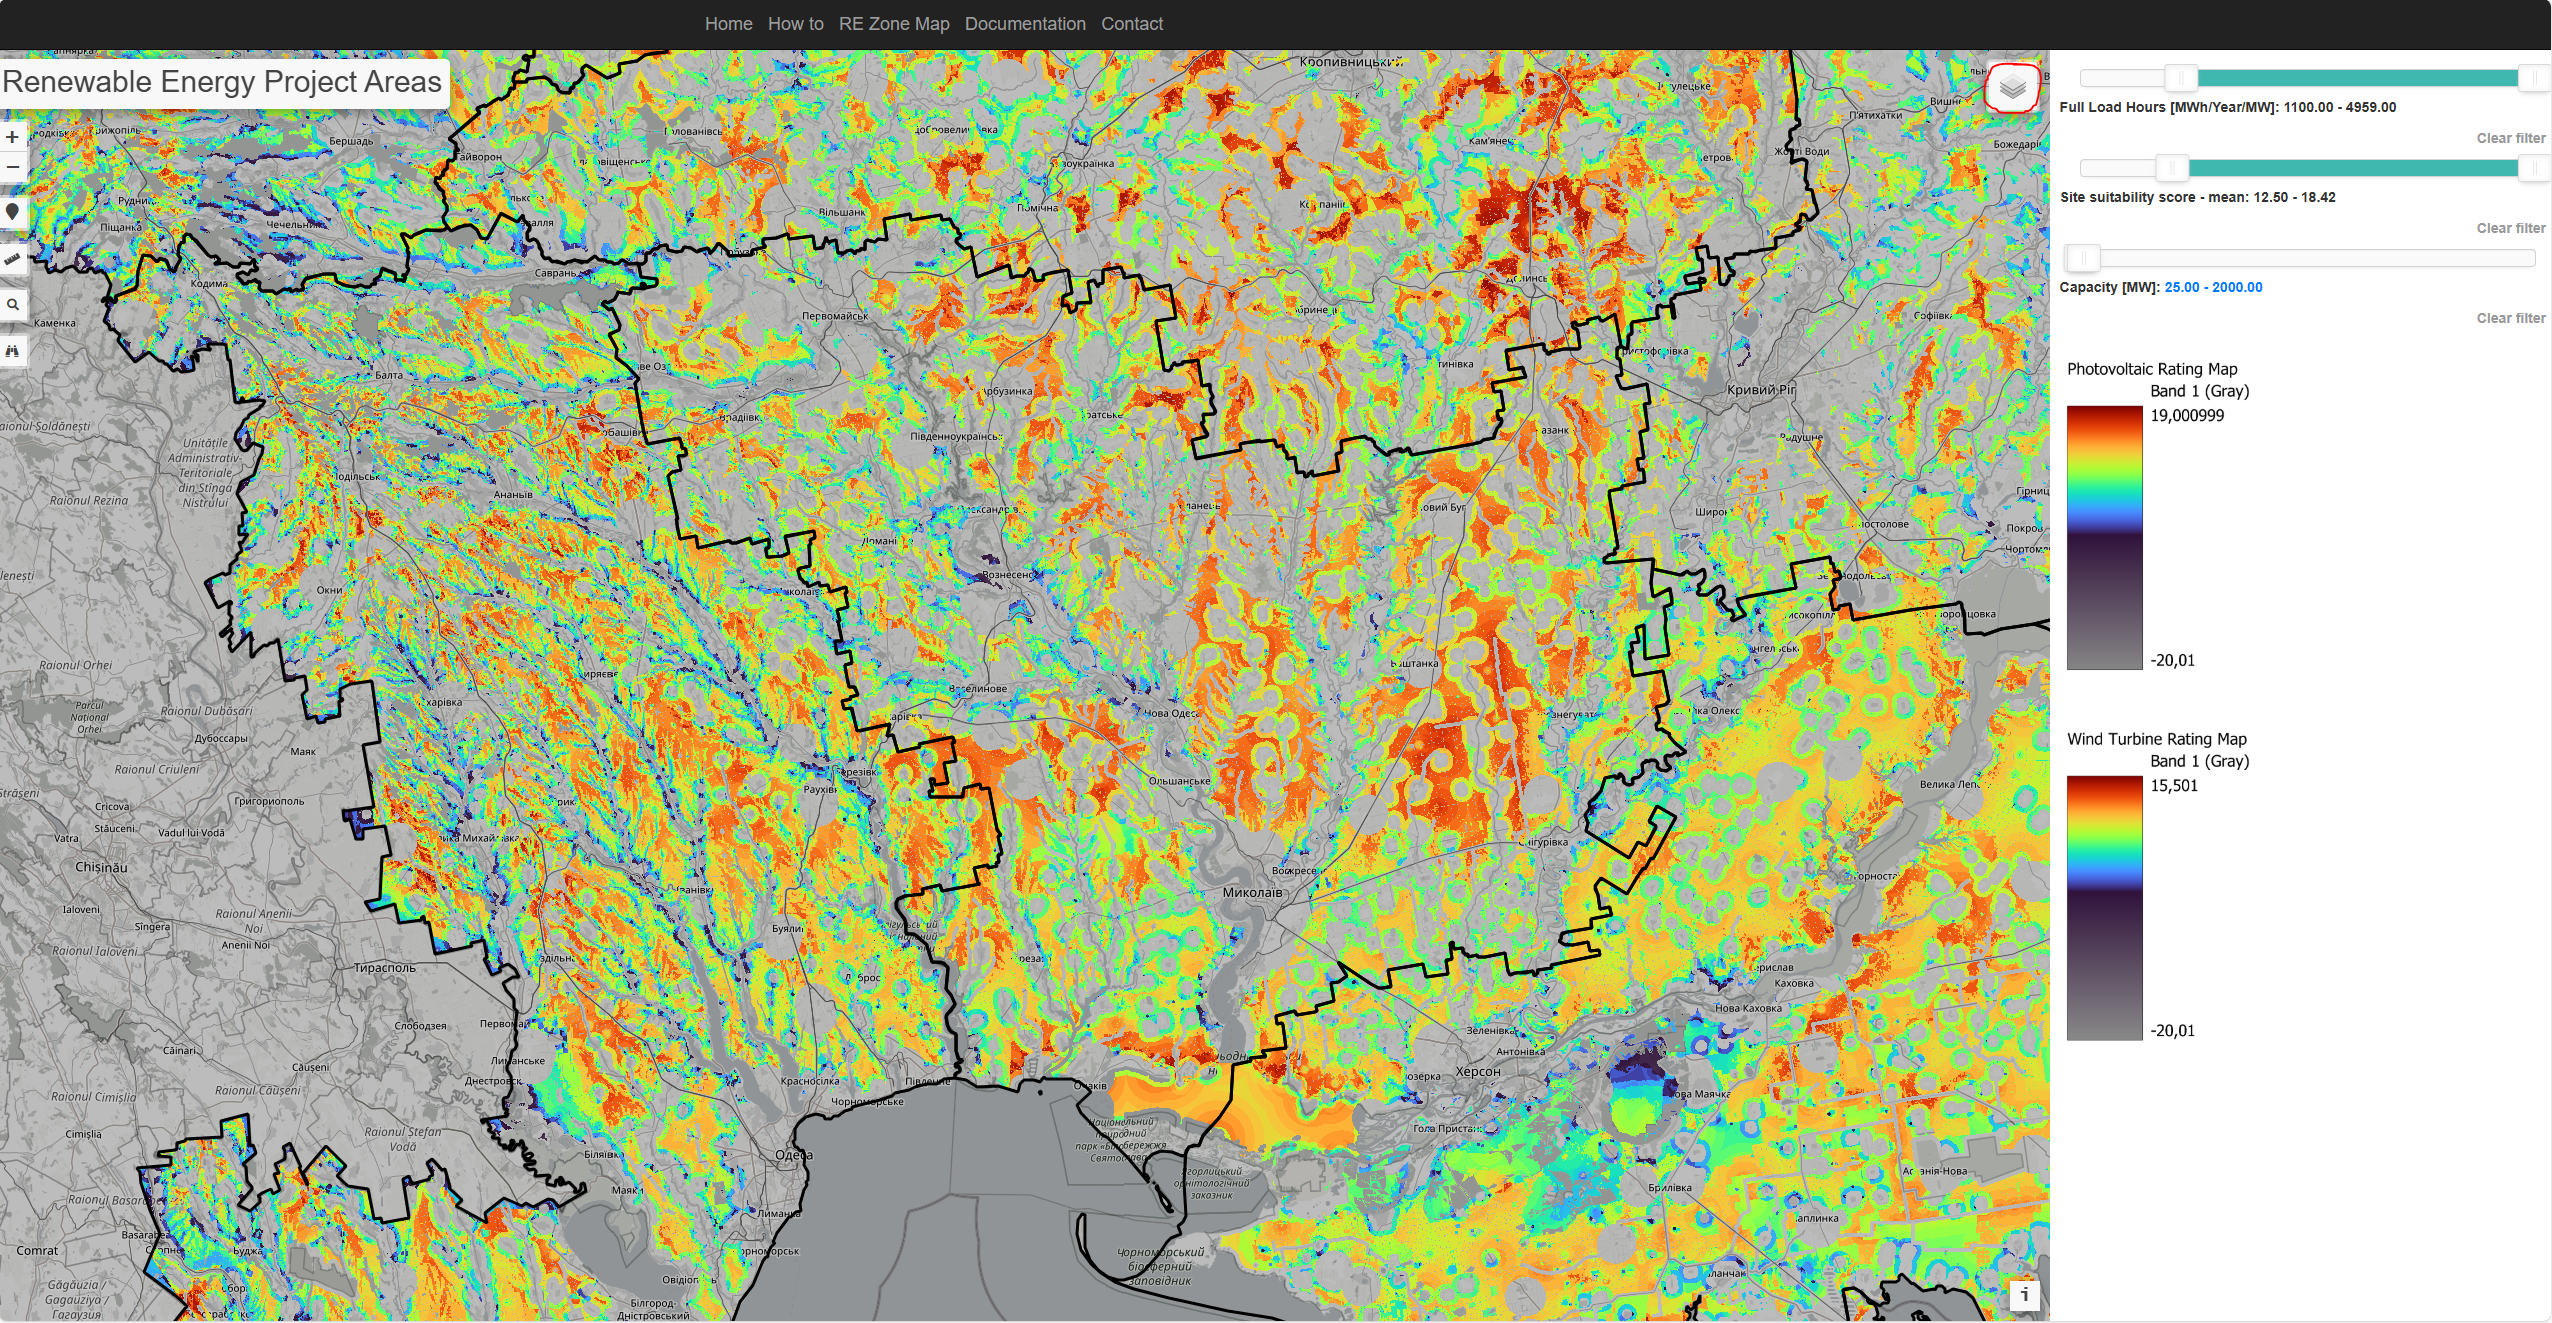
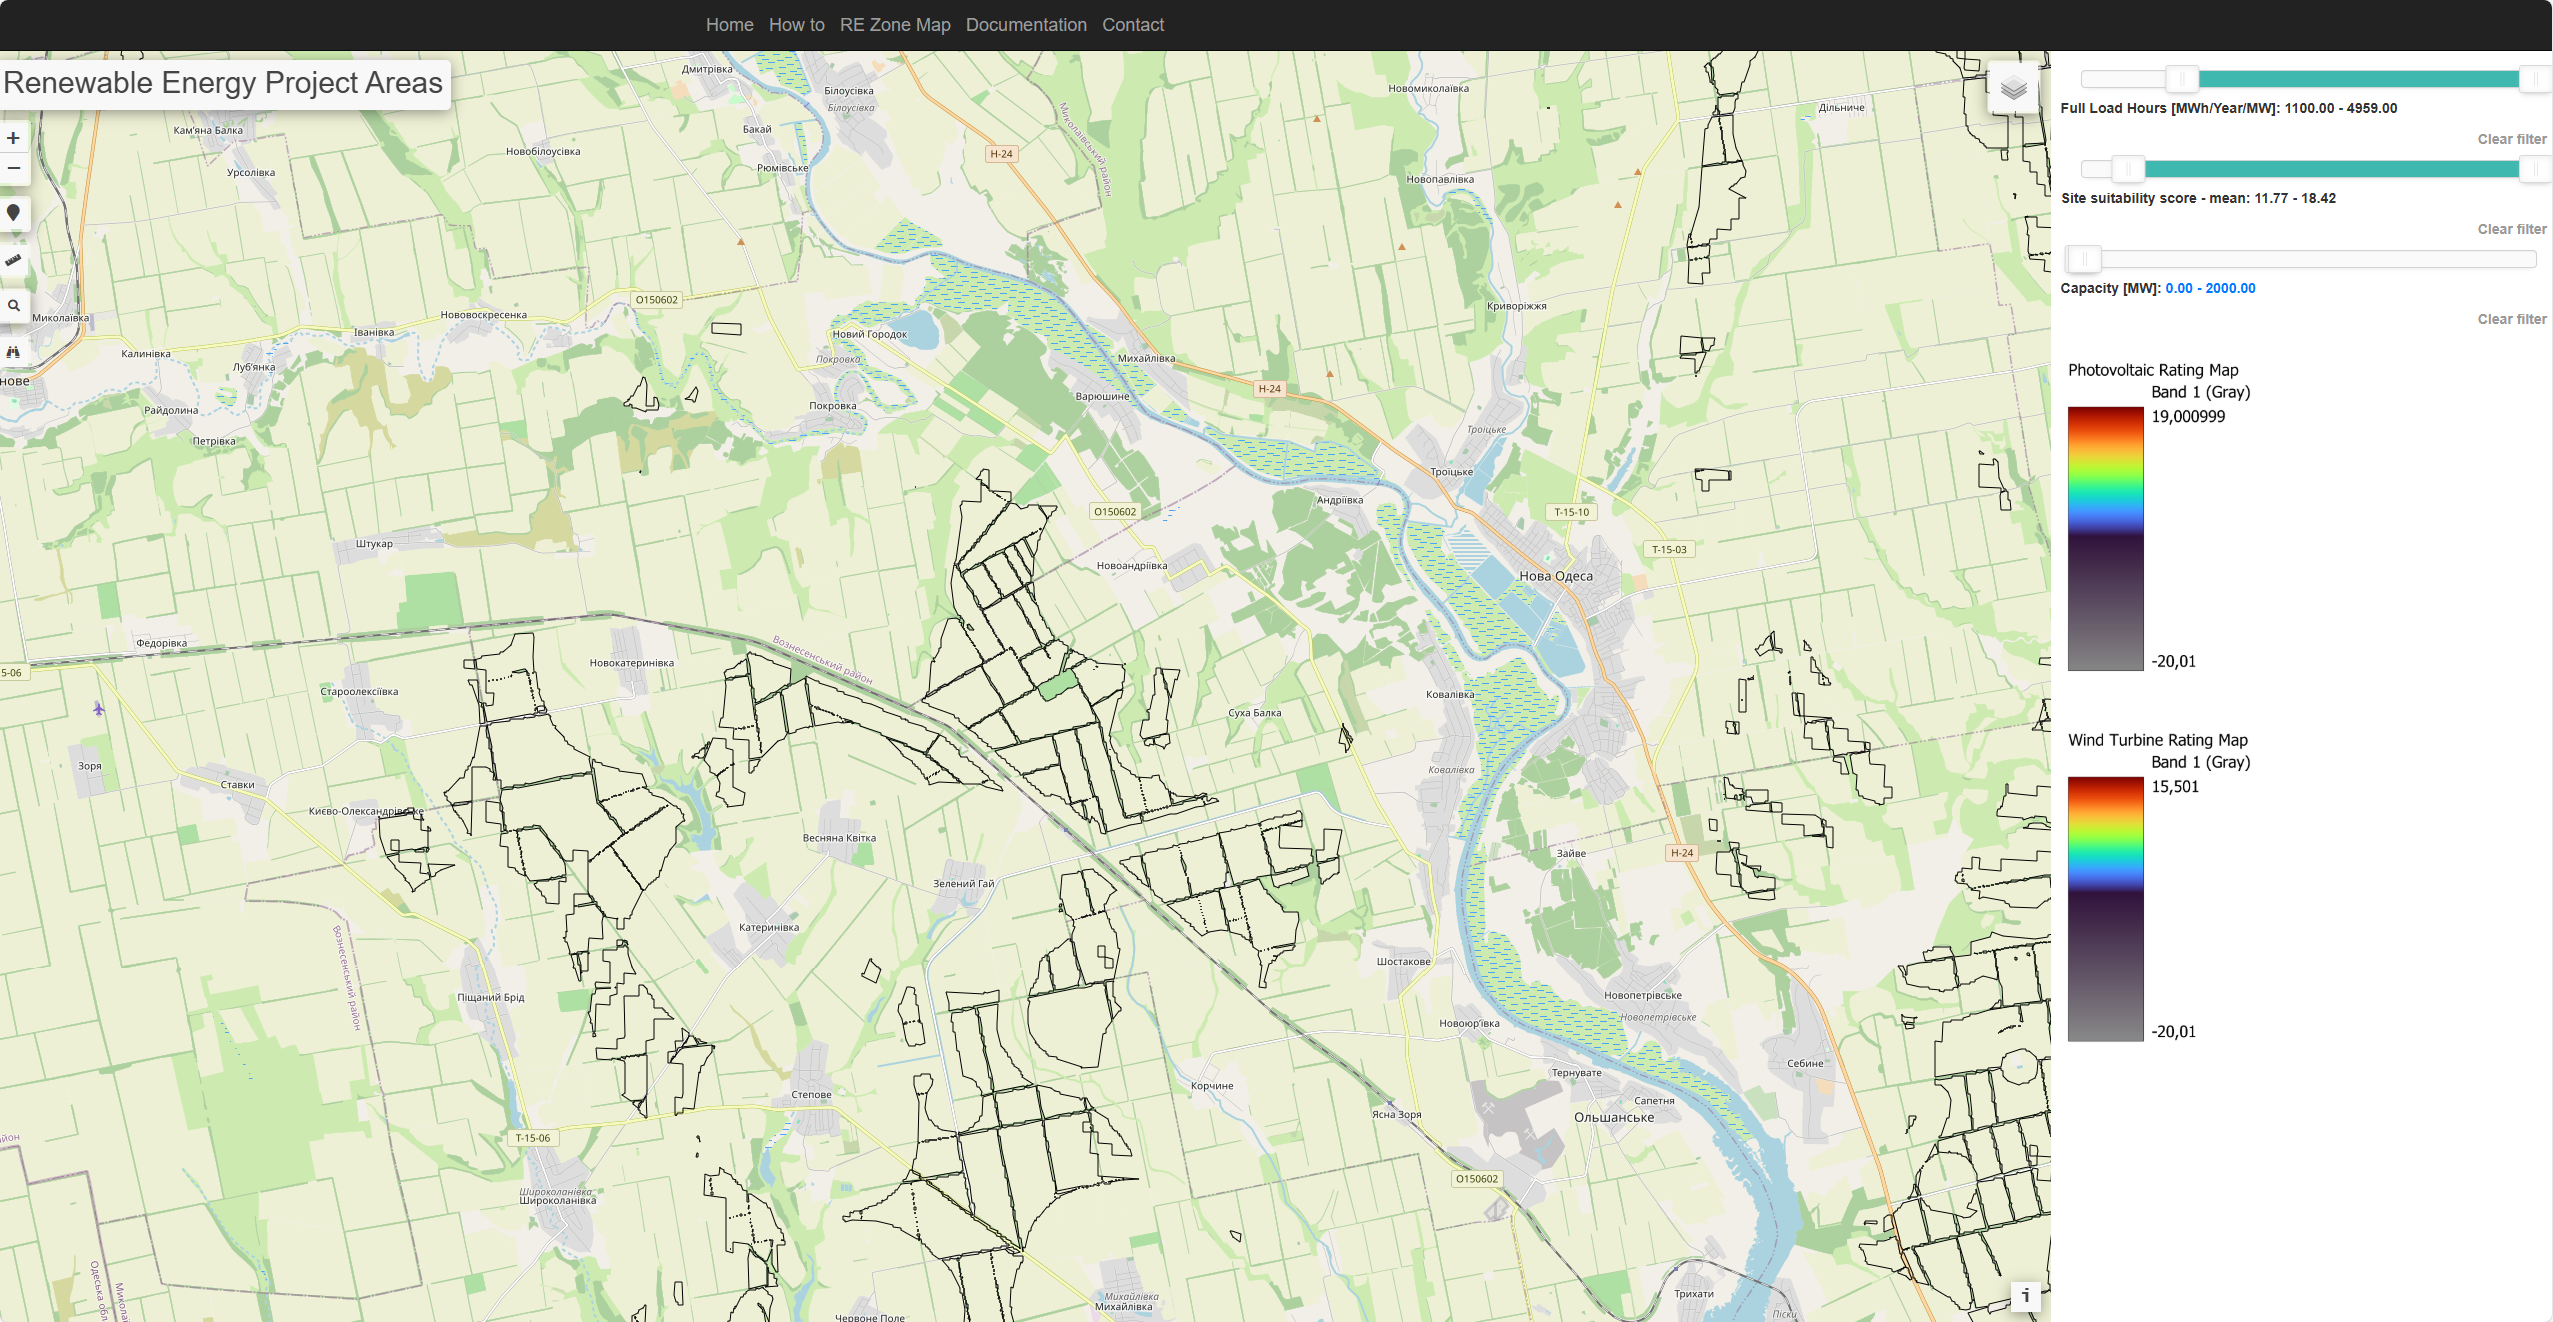
STEP 6: VALIDATING THE POTENTIAL PROJECT SITE
How to:
Activate the normal Open Street Map in the menu, keep the project site activated and deactivate the rating map, by clicking the buttons marked with red.
Check if there are any conflicts on the map by zooming to the appropriate level.
Use case: The process enables you to easily validate if there are any conflicts with establishing photovoltaics or wind turbines at the potential project site. As the user can see details of what is in the vicinity of the potential project site.
STEP 7: USE THE VALUES FOR A FURTHER FEASIBILITY STUDY OR GOVERNMENTAL GUIDDANCE
How to: Hover over the potential project site and in the same way as for Step 5 a textbox appears which shows key results and use the values for various purposes.
Use case: Use the values to conduct a proper economic feasibility study or to guide planning related authority, amongst other use cases.
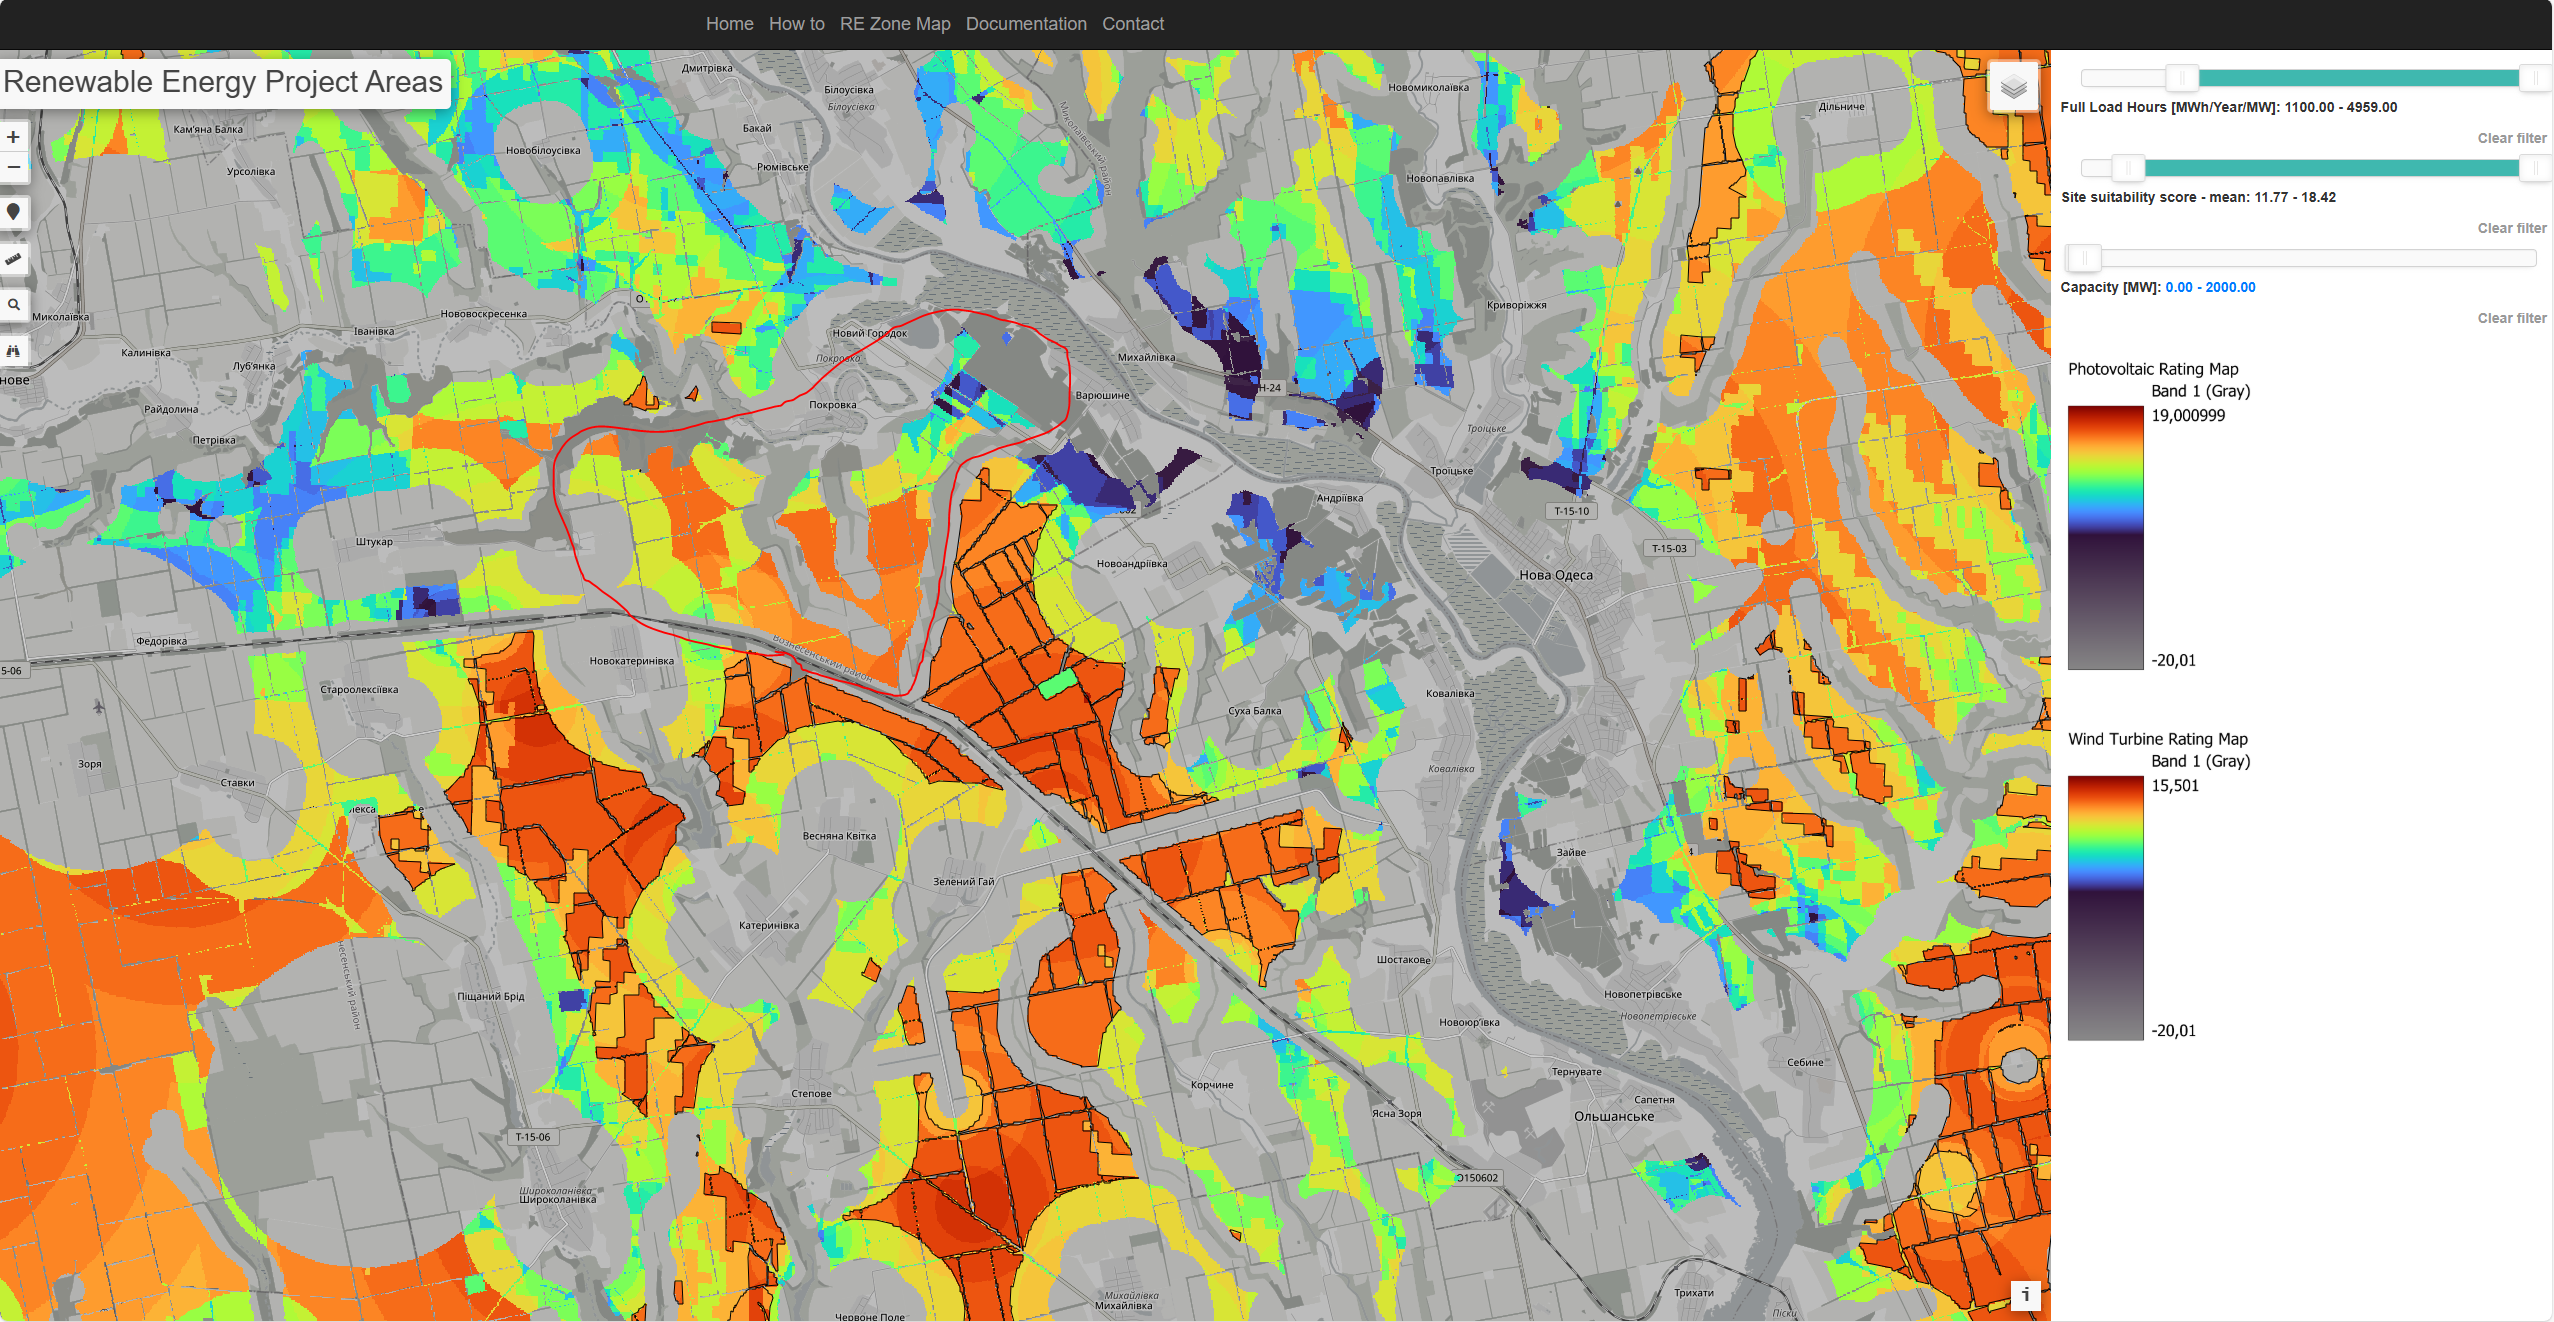
HOW PROJECT SITES ARE DERIVED
Project sites are formed by removing areas with a suitability score below 11 and merging areas within certain distances. The rating map layers show more possible locations than the project site layers, but these are considered less attractive based on their scores. Areas not shown as project sites can still be suitable for setting up photovoltaics or wind turbines, for these areas the color-scale rating can be used for guidance. An example of this could be the area to the west of the project site drawn with red, as can be seen in the image. Transparent map sections indicate excluded areas.
Functions
The REZOMA map is designed to help identify and explore photovoltaic and wind turbine project sites. By filtering for specific capacities and suitability scores, it is possible to glance at which areas are most promising and dive deeper into the feasibility of each site. Below is a quick guide to each map function and a description of the functionality and how it can be useful:

Search for Project ID
How to Use: Enter or look up a known project ID to instantly locate that project on the map.
Use case: Quickly jump to a specific site from the REZOMA data set for follow‐up, comparisons, or detailed review.

Search for Address
How to Use: Type in an address, city, or place name to zoom directly to that location.
Use case: Check how a specific address aligns with REZOMA‐identified zones, ensuring local suitability for renewable energy development.

Measure Tool
How to Use: Click the ruler icon to measure distances or areas by drawing lines or polygons on the map.
Use case: Determine how close potential sites are to key features—like transmission lines or sensitive areas—to better gauge feasibility.

Get User Location
How to Use: Click the location icon to get the user's current location on the map.
Use case: Determine how close potential sites are to the user, so that they can check their local area.

Zoom Out
How to Use: Click the minus (–) icon to view a broader area of the map.
Use case: Compare multiple regions at once and understand large‐scale resource distribution or project clustering.

Zoom In
How to Use: Click the plus (+) icon to see a closer, more detailed view.
Use case: Focus on a single zone or site to identify constraints—such as slope or nearby buildings—that might impact project viability.

Layers
How to Use: Toggle different map layers (e.g., heatmaps, administrative boundaries) on or off to customize your view. Furthermore, it is in this function that it’s possible to choose between viewing suitable sites for wind turbines or photovoltaics or the resource maps.
Use case: Switch between data layers—like suitability scores or infrastructure—to see how each factor impacts project potential.

Score Filter
How to Use: Adjust the slider to display only the project sites that fall within the desired suitability score range.
Use case: Target sites that match your priorities—whether higher scores for the best potential or lower scores for specialized needs.
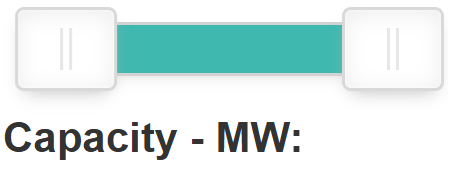
Capacity Filter
How to Use: Move the slider to filter sites by total capacity (in MW).
Use case: Home in on projects aligned with your specific production goals, whether large‐scale developments or smaller installations.
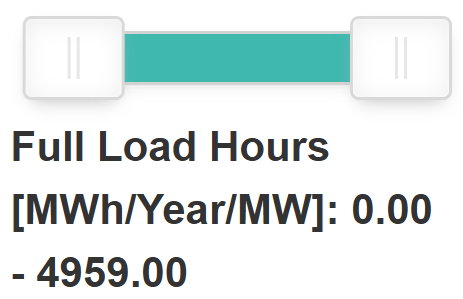
Full Load Hours Filter
How to Use: Move the slider to filter sites by Full Load Hours.
Use case: Zoom in on projects aligned with your specific production goals.
By combining these tools—searching by ID or address, measuring distances, filtering by score or capacity, and zooming in on specific oblasts—you can quickly find and assess the most promising sites for renewable energy development. This empowers government agencies, developers, and communities to make data-driven decisions and streamline project planning under the REZOMA framework.